Spacecraft: Configuring User Interface
Adding in the User Interface
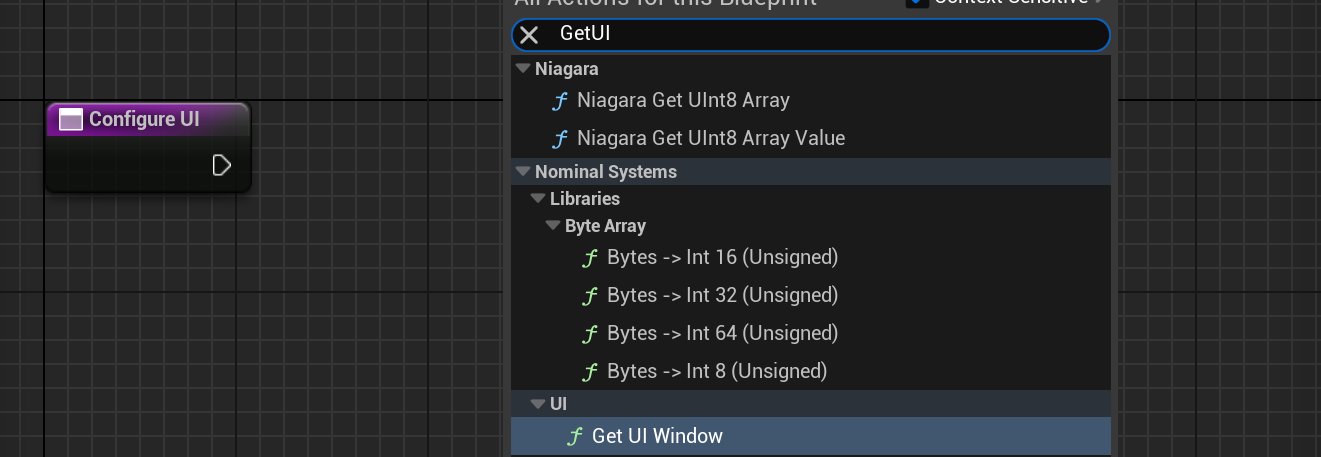
In Nominal Editor, the standard User Interface (UI) widgets are the Nom UI widgets. The Nom UI widget controls several widgets that can be displayed on the screen and allows for the visualization of graphs, maps and logged information. The first step to running the UI is to create an instance of the UI manager at the level. This is typically done as the last step of the Begin Play event on the level blueprint, in a function called Configure UI.
After adding the function, to refer to the UI widget, use the Get UI Window function, which will return the master window of the interface. This is the default view that already includes a clock and the visualization information when the play button is pressed.
Adding a Plot
The widget that will be added to this tutorial is the plot widget. This allows for a custom graph to be drawn that plots some data on the Y-axis against the simulation time on the X-axis. This is used to show how some data points change over time. A plot can be added by calling the Add Plot Widget function on the UI window.
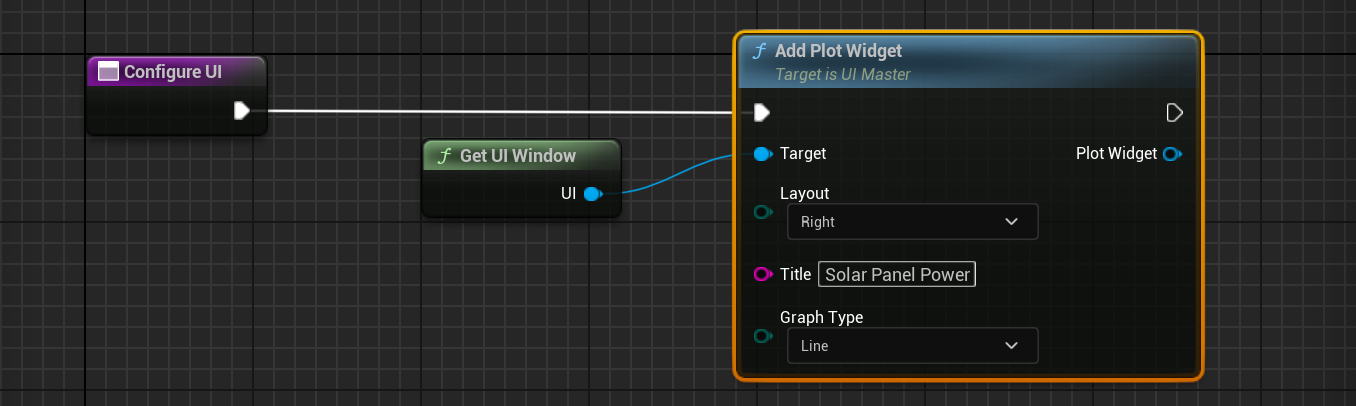
For each of the widgets that are added to the level, they can be located on the left, right or centre configurations. By default, plots will be located on the right panel, while logs are located on the left. Additionally, along with a title, the graph type can also be initialized for the plot.
Note
A single plot only defines a single widget. Multiple plot properties can be added to each plot. This tutorial will not cover custom plots with custom data.
Adding a Plot Property
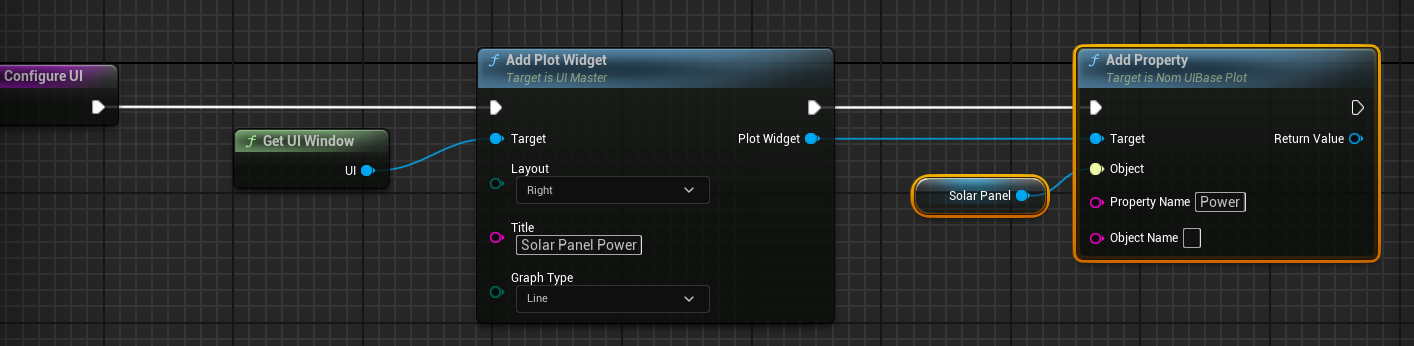
A plot by itself will not show any data. A plot property needs to be created and configured. Select the Add Property function for adding in a standard property. The advanced options enable custom properties.

For the Object field, drag in the object that the data will be tracked (which can be of any simulation type, including spacecraft and solar panels). For the Property Name field, this must be the exact name of the property that should be automatically tracked. In this case, the power will be tracked over time from the solar panel. The Object Name can be left as blank and is useful for when there are multiple properties of the same name on the same widget.
Warning
For the automatic plot properties to work, the property name must be exactly the name of the simulation data being used. Each component references a Nominal simulation object and the variable chosen will have the same name as the variable reference on the object. The names will not include spaces and are case-sensitive. The list of variables available in each class can be found in the following document:
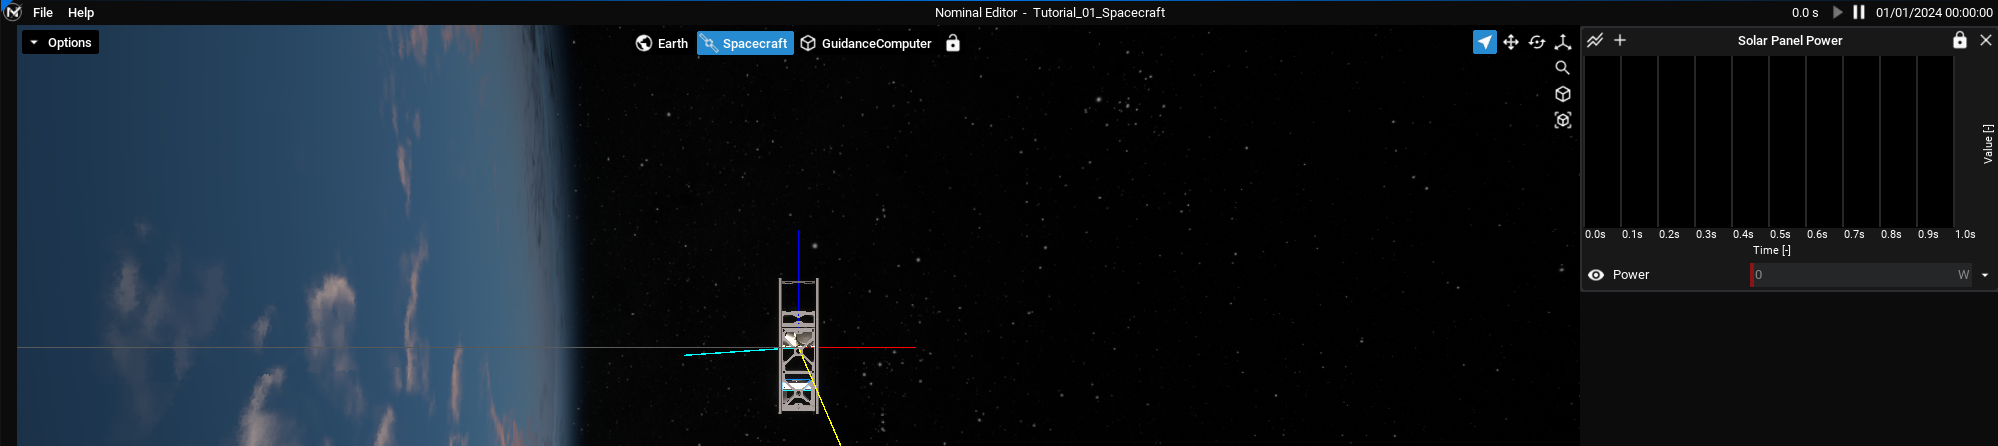
Displaying the Plots
Once the plot configuration function is added to the Begin Play, the plots will be updated in each frame and will be shown to the level. Since the simulation has not started yet, the data will appear to be empty.