Data Downlink: Completing the Simulation
More Plots
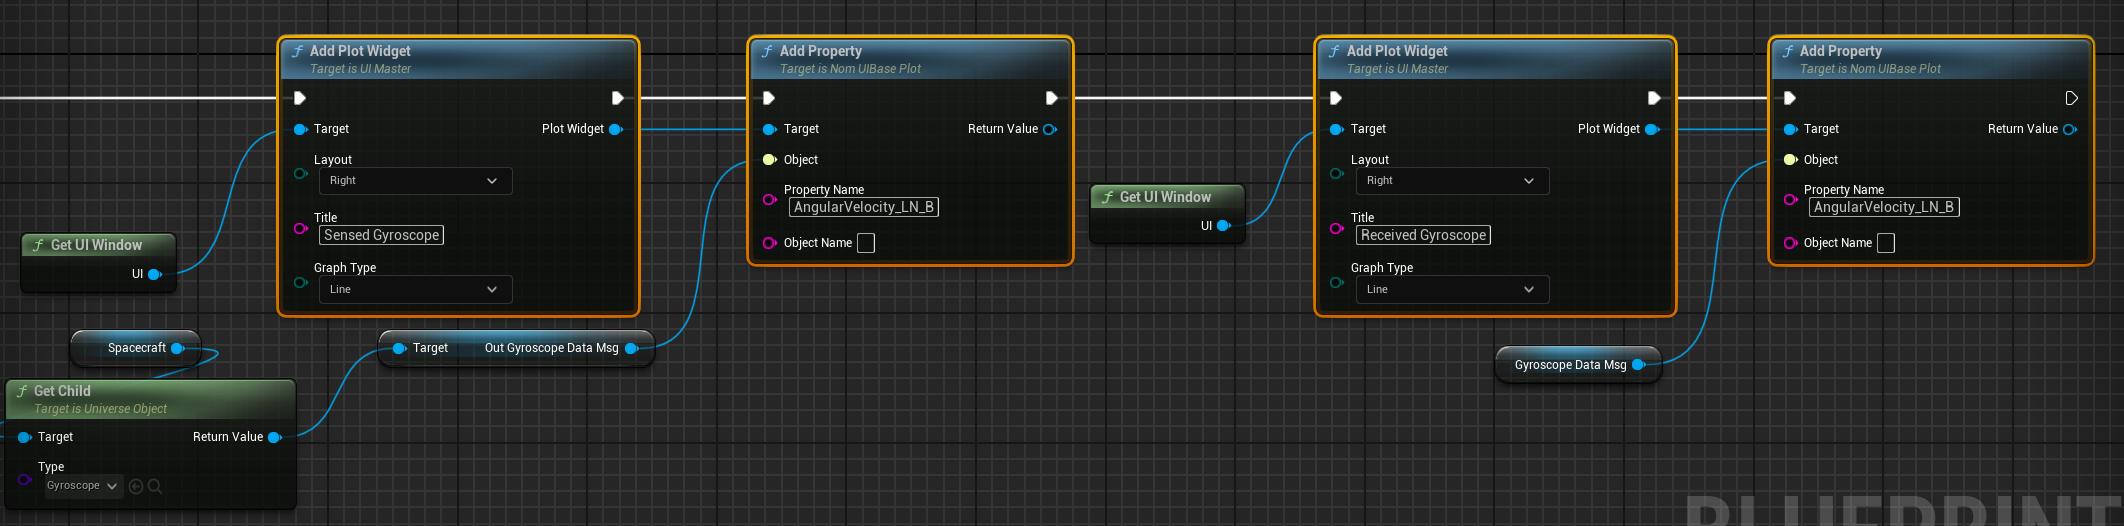
In the previous document, the data display for the CSS message from the sensor and the TT&C system was displayed on a graph widget. The same thing can be done for the gyroscope data. Instead of using one plot to show the data, two widgets will show the data as each of the values is a three-part vector. This would require a total of 6 data-points to show on the graph correctly. Use the AngularVelocity_LN_B property on the message to plot both the sensor and the received data.
Executing the Simulation
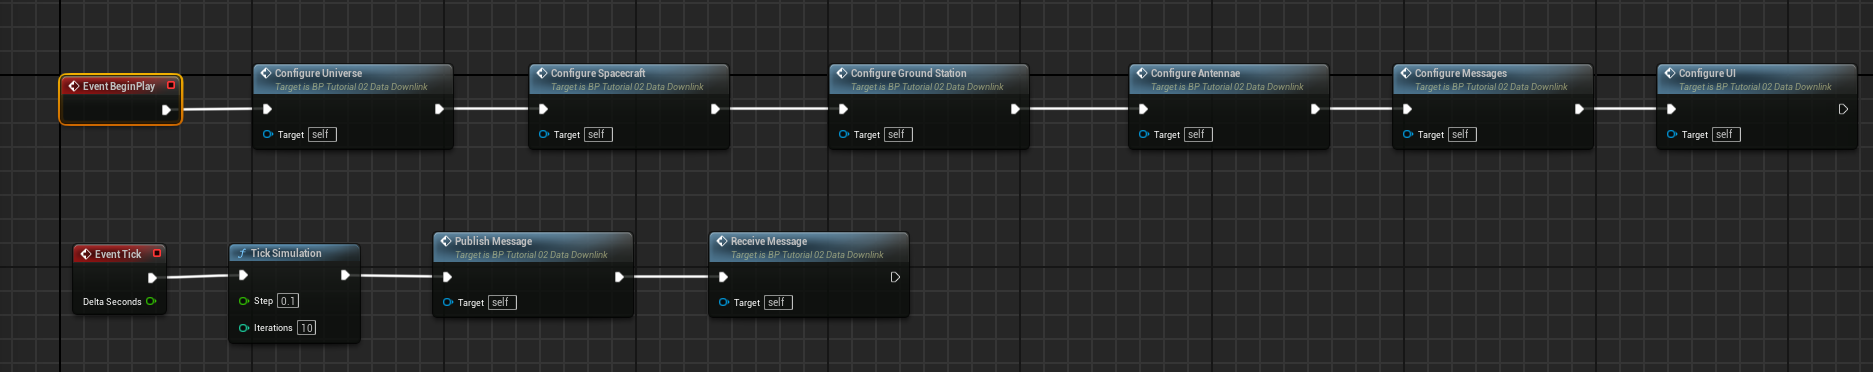
The event graph on the level blueprint should look something like the following:
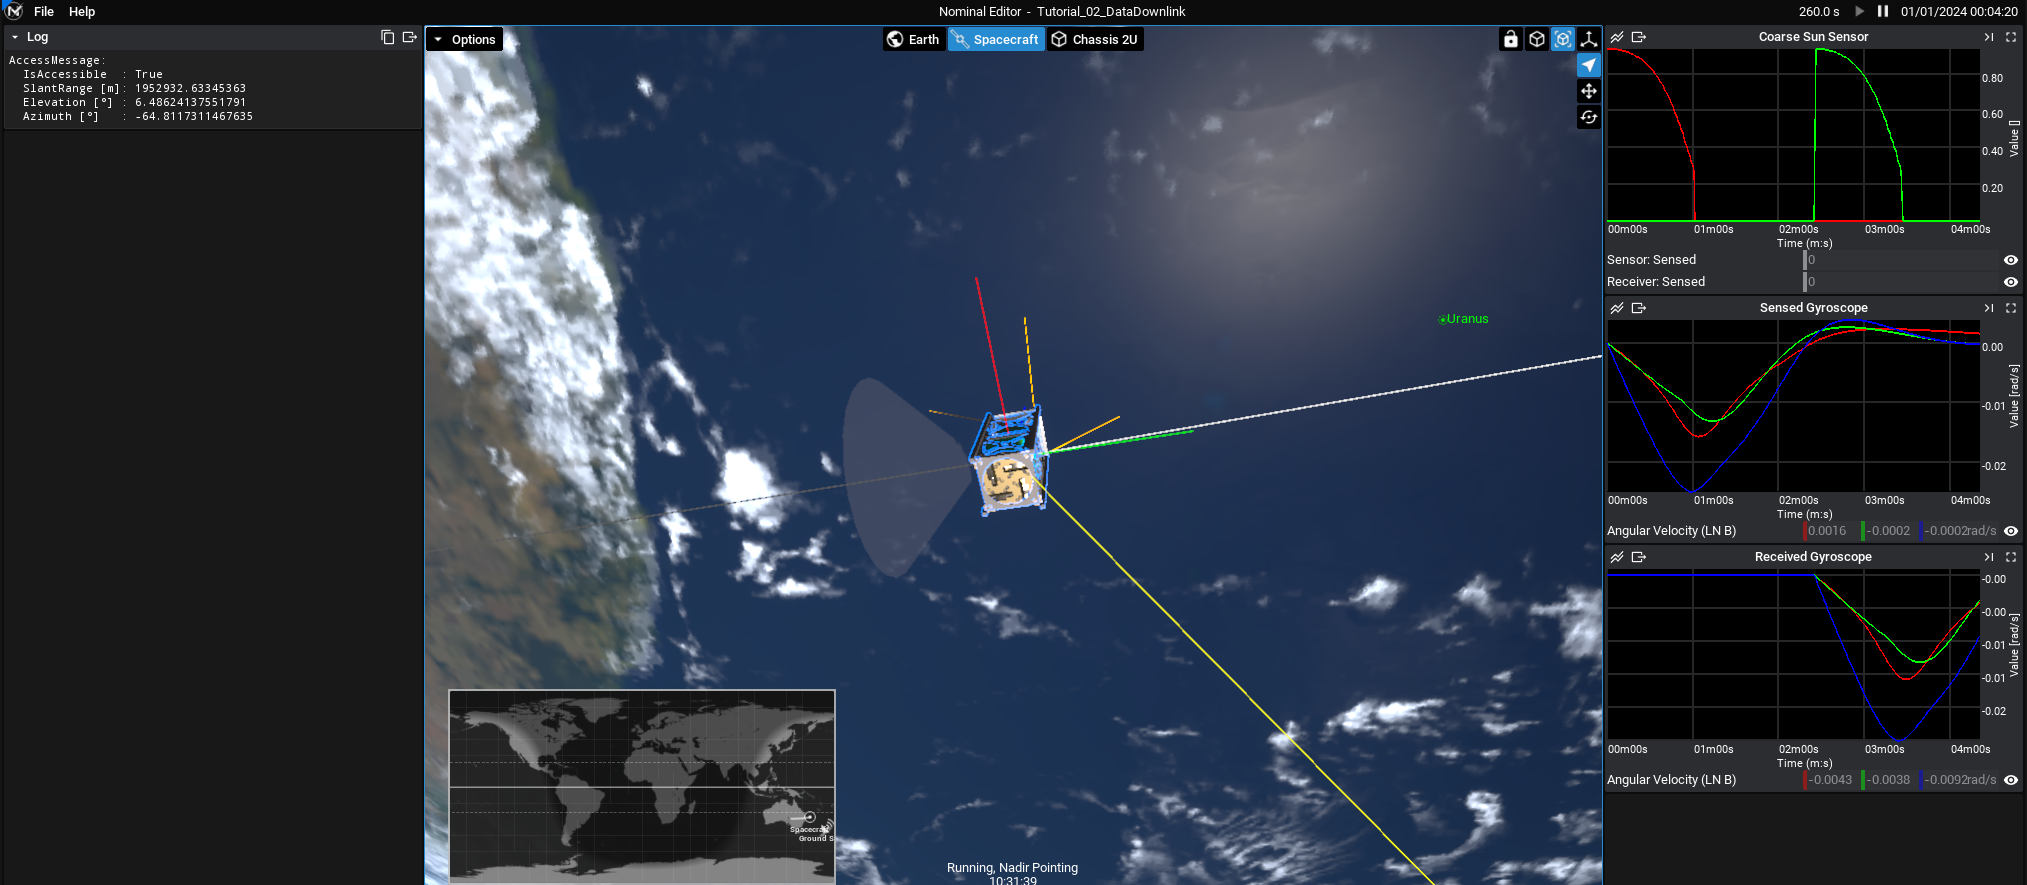
The tutorial is complete. When the tutorial is played, the spacecraft should rotate towards the Earth and transmit sensor data from a CSS and a gyroscope. The sensor data is transmitted from the transmitter to a ground station. The ground station then decodes the messages in order and plots the same data to the graphs on the screen, showing a delay between the real-time data and the received data.