Spacecraft: Plotting Data
Adding Plots
Plots can be added to the simulation which will show off the data available. To open up the plotting window, select the Plotting panel that is located next to the Inventory panel.
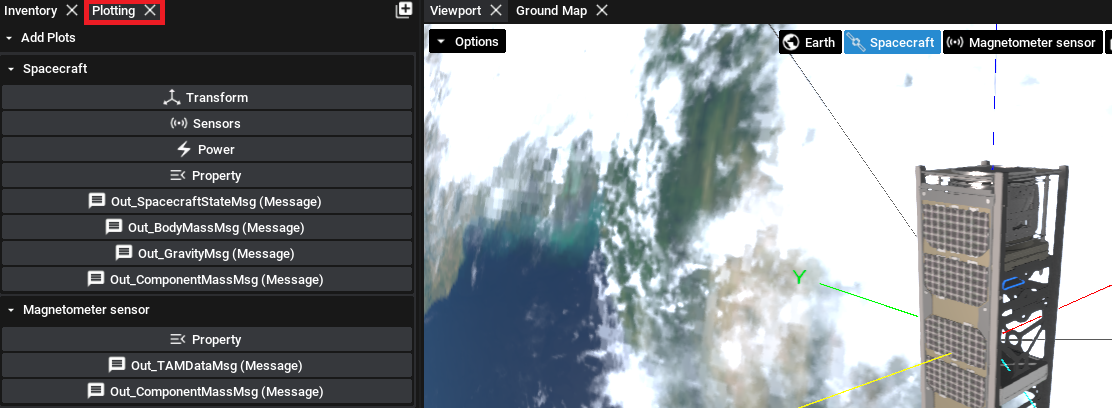
Many different plot options will appear by default when this is selected. This tutorial will add two plots to the window:
- A magnetometer reading plot, showing the magnetic field detected
- A solar panel power plot, showing the amount of power the solar panel is producing from the sun.
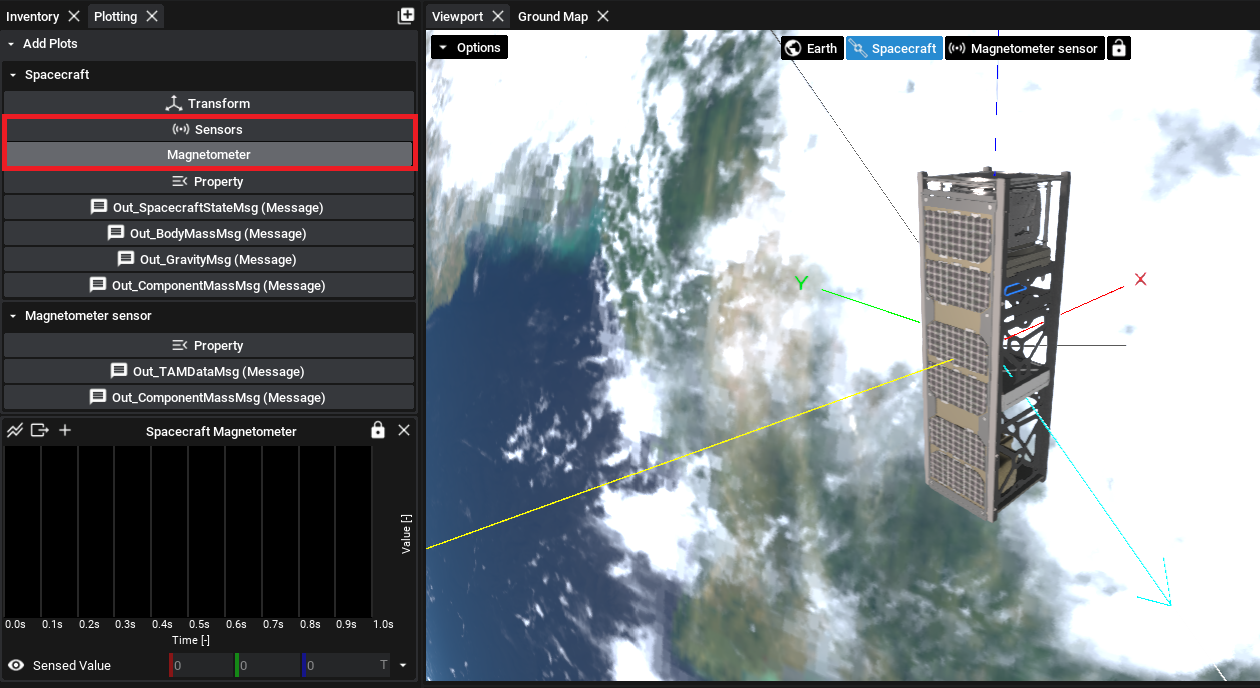
The first plot can be added by pressing the Sensors option on the spacecraft and selecting the Magnetometer. This will add a plot that will show the sensed value in Teslas in each of the three axes.
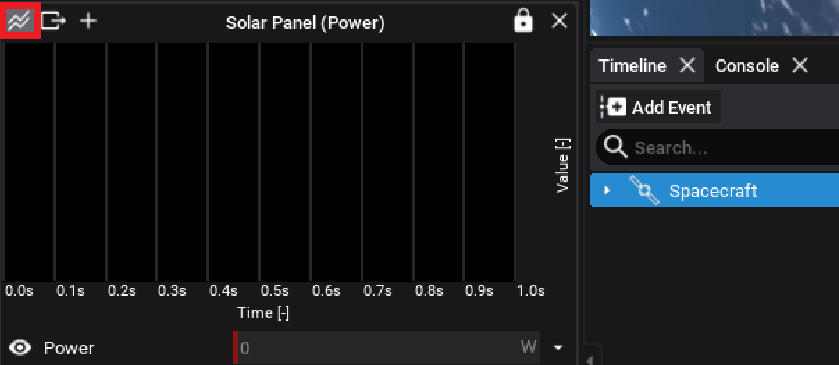
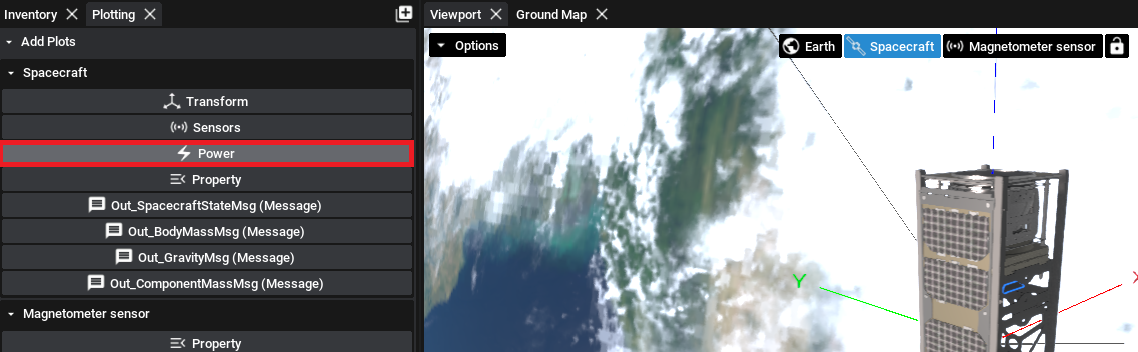
The second plot can be added by pressing the Power option. This will show any battery or solar panel plots in the view by default. Since only one solar panel is added here, just the singular plot will be added.
Configuring Plots
The plots will automatically fill up with data once the simulation starts to run. The plots can also be toggled between bar and line plots by selecting the plot option button in the top-left of each plot. There is also an option for exporting the data as a CSV file and adding another property to the plot. Since there is only one solar panel, switch the solar panel power plot to a line chart instead.