Power Network: Configuring User Interface
Adding Graphs
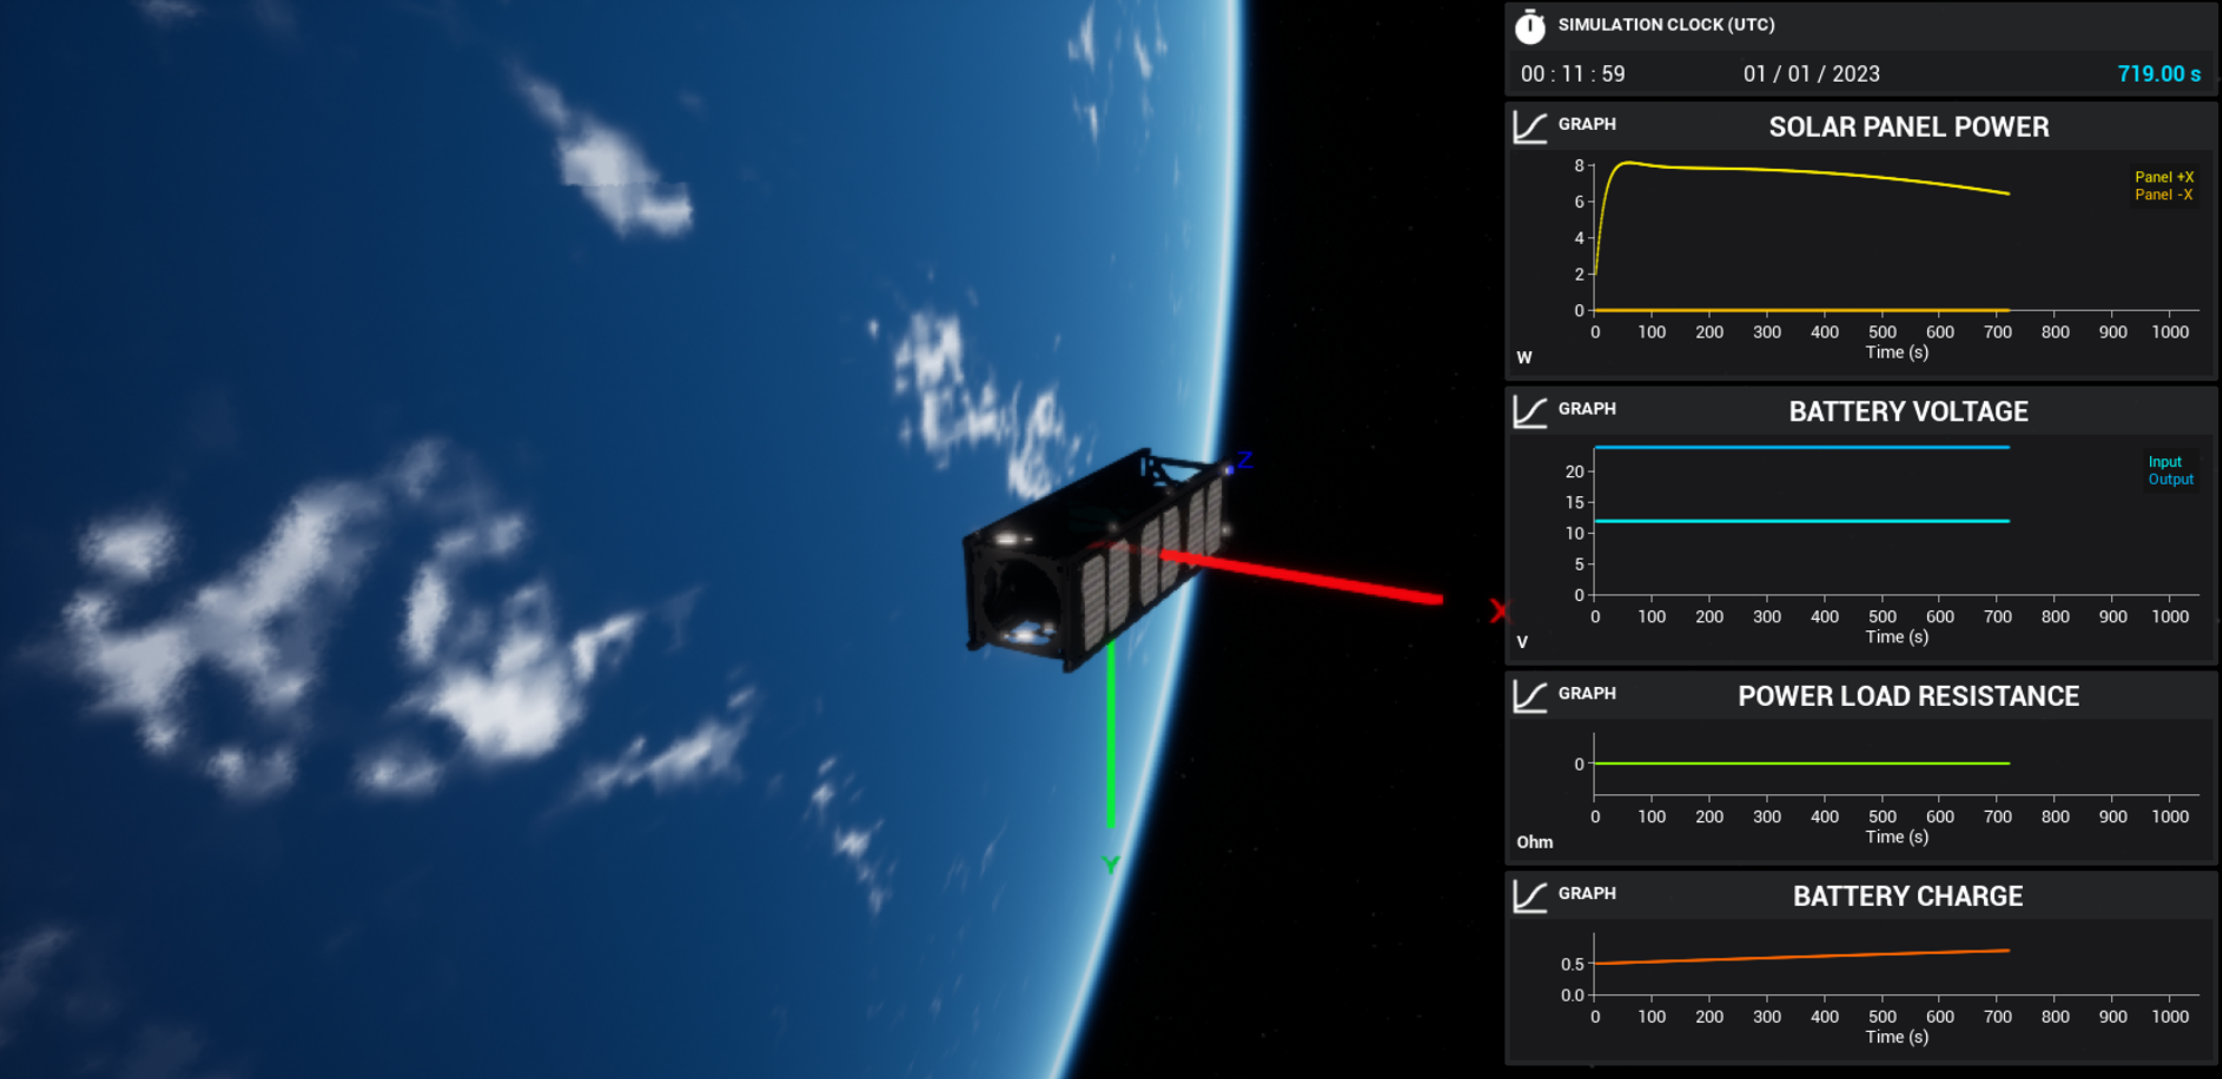
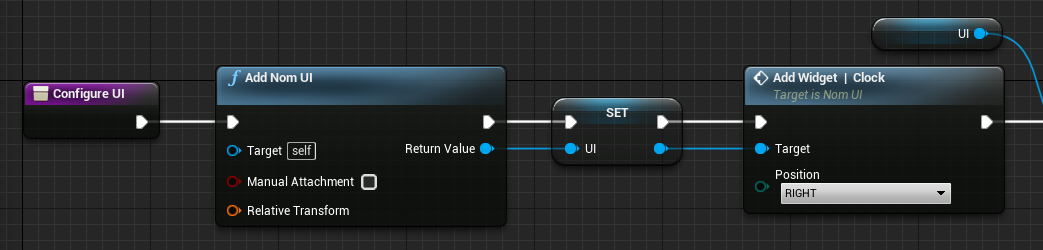
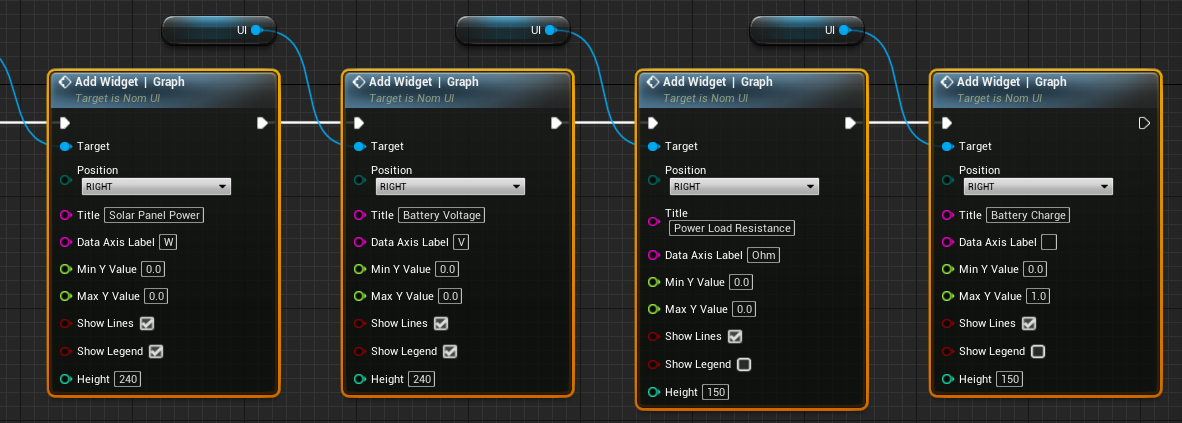
Similar to the previous tutorials, the user interface can be added in the same way and a simulation clock will be added to the display on the right-hand side. For the first part of this user interface design, four new graphs will be added. One will show the produced by the two solar panels on the same plot, the second will show the input and output voltage into and out of the battery, the third plot will show the resistance of the power load and the final will show the battery capacity as a fraction.
Plotting Graphs
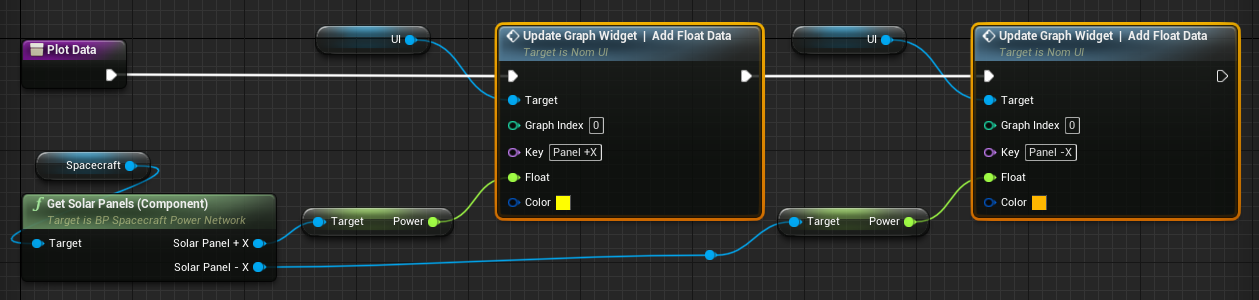
In a new function on the Tick event graph, the data points from the power components will need to be plotted. The first is the solar panels that will be plotting their power output over time. Each solar panel will be plotted on the graph, with index 0, as it is the first graph to be plotted.
The next graph is the battery voltage. To retrieve the battery information about the power node, the Out Power Node Msg must be retrieved. This message exists on all power components and provides information on the voltage, current and resistance of the node. This can be found on the Get Out Messages function on the battery. Once the battery message has been retrieved, the Read Power Node Message static function can be used to expand the data from the message. In this case, the data will be in the form of a double.
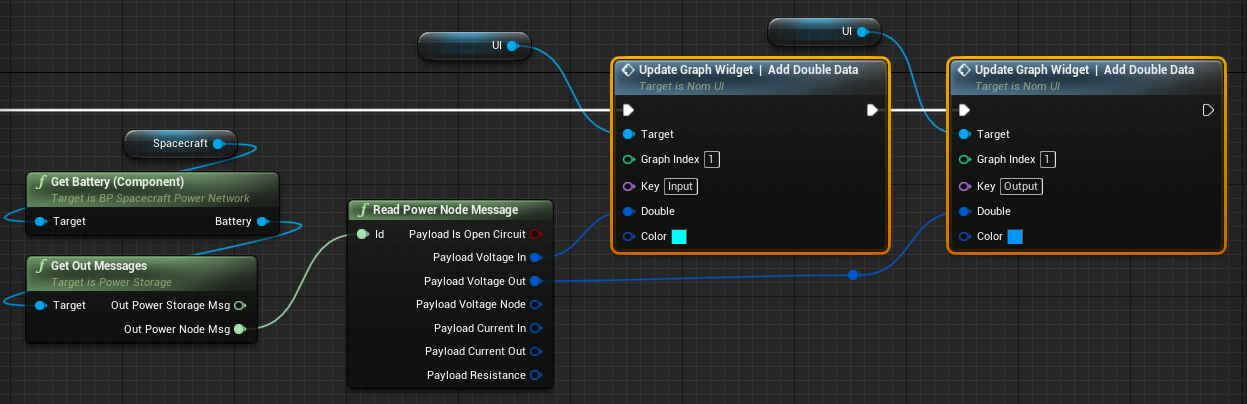
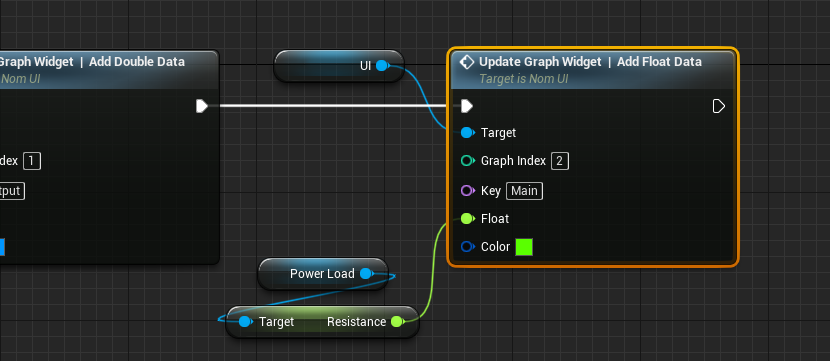
The next graph will display the resistance of the power load. This resistance will change when the camera takes a photo which will be handled in the next document. This can be read from an exposed resistance parameter.
Note
For the power node, the power message will also export the same value as the exposed parameter. The choice of which method to use is up to the user.
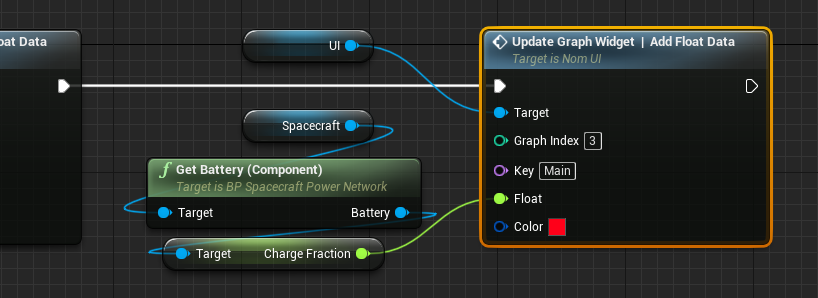
Finally, the graph that displays the battery charge can be pulled from the battery on the spacecraft using the Charge Fraction value. This will be on the graph with index 3, as it is the fourth graph added.
Ticking the Simulation
When the simulation runs, the solar panel power will reach a maximum once the pointing mode is achieved. Over time, as the sun moves away from the spacecraft’s direction, the solar panel power will decrease. The voltage will remain the same over time, as will the resistance, but the battery will slowly charge from the solar panels.