C#: Debugging in Unreal
Although the code written in Editor C# is in a separate project and is not natively supported by the Unreal Engine, it is possible to debug the code in Unreal by using an instance of the Mono Remote Debugger, which is embedded in the Nominal Editor project. To enable and start debugging, all that is required is to connect the debugging through the IDE.
Warning
At this stage, Visual Studio may not be able to perform remote debugging. This process can be done using IntelliJ Rider 2022 or later. This guide will show how to set this up using this IDE and not Visual Studio.
Connecting up the Debugger
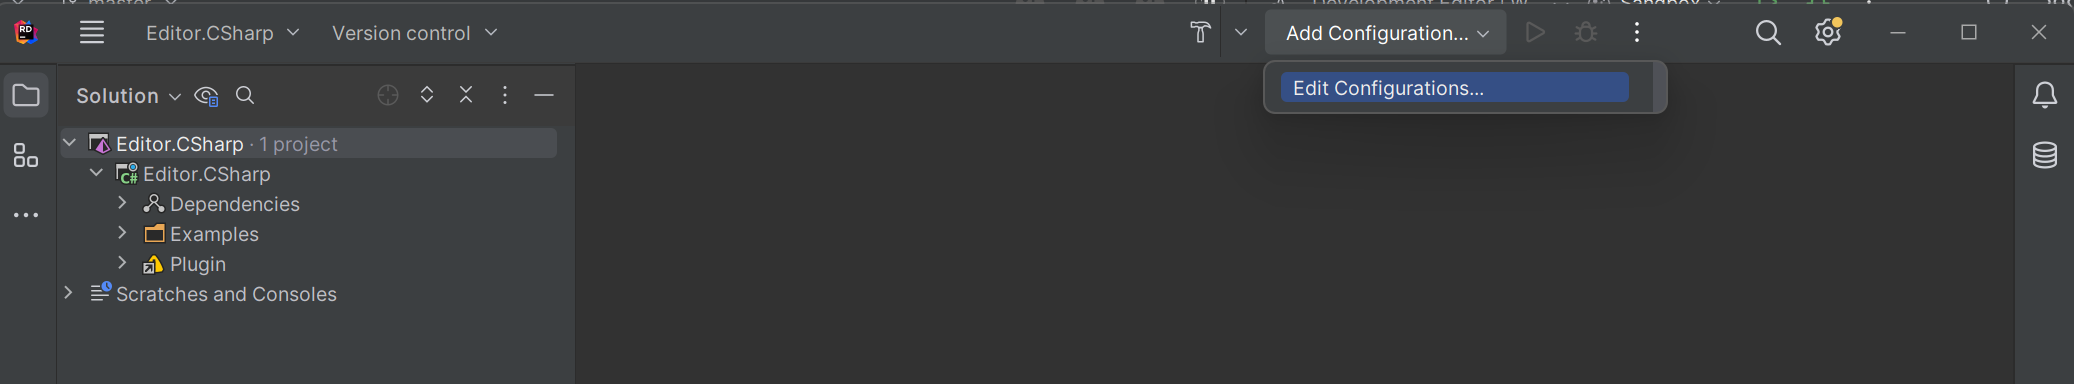
First, the solution file should be opened up in Rider. This can be done from the Scripts folder where the solution for the project exists.

Once the has finished loading, in the top-right of Rider there should be an Add Configuration button if a configuration has not yet been added to the project. Select this option and from the drop down select Edit Configuration to create a new configuration.
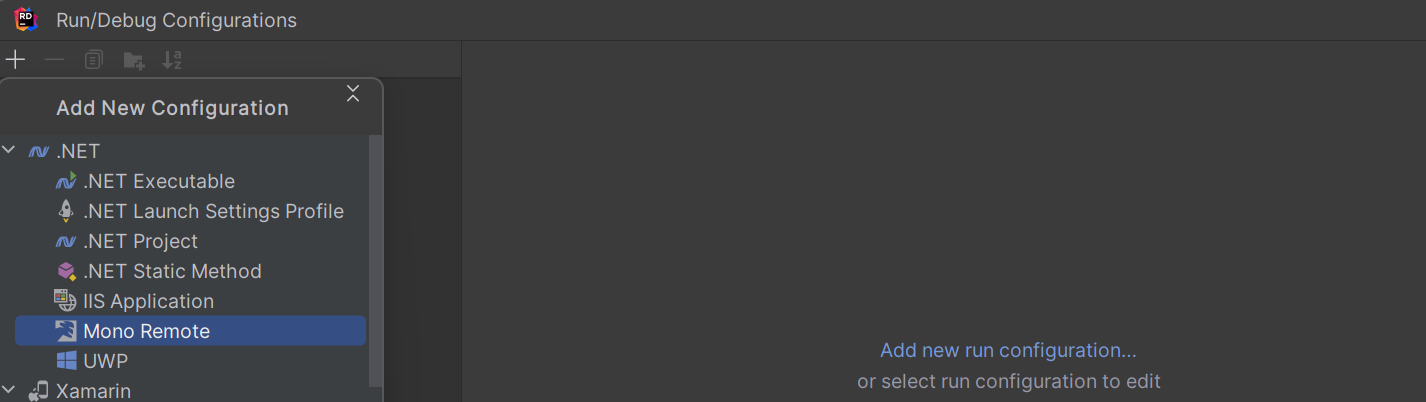
In the configuration option, select the plus icon and find Mono Remote as the option for the debugger. This is an embedded Mono system that can connect to Nominal Editor or any other Mono project provided that debugging has been enabled.
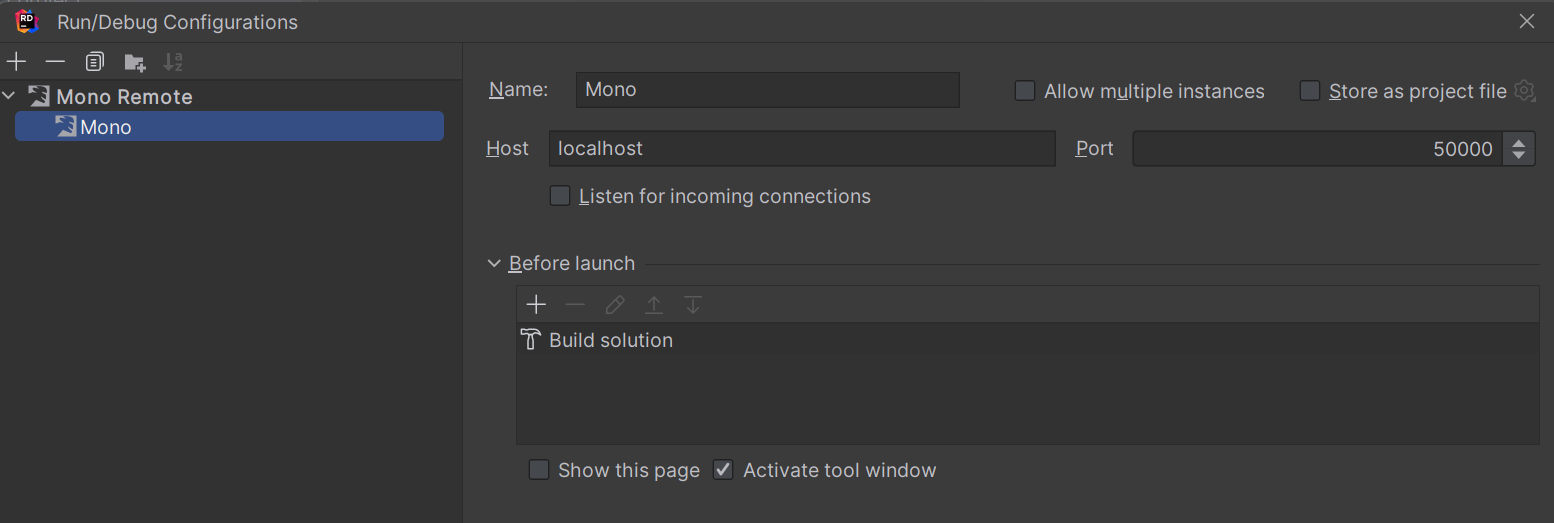
Once added, give the configuration a name (in this case, it is just called Mono) and make sure that the host and port are left as the default options. Additionally, add a rule to the Before Launch section to Build Solution. This ensures that every time the project is launched or built, the code in C# will be built and copied to the Nominal Editor Mono folder to ensure the DLLs are up to date.
Running the Debugger
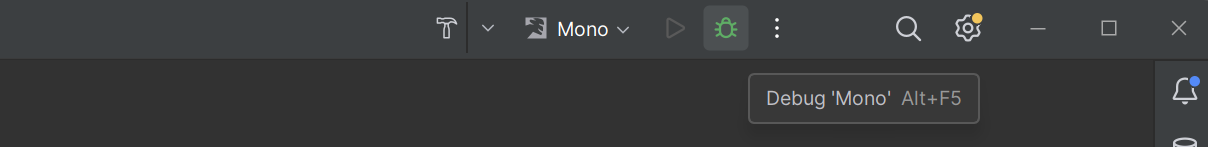
Once ready to debug, hit the green bug icon once the solution is selected in Rider and this will build the solution and start the debugger.
Warning
Each time the DLLs or C# code changes in the solution, Nominal Editor must be restarted. Nominal Editor currently does not support hot-reloading for the C# files.
The debugger will wait for a solution to be connected for about a minute. If it cannot find the solution in time, it will stop debugging. If this happens before Unreal has been opened, then the debugger can just be restarted. Provided no change to the C# code has occurred, the debugger can also be started while the project is running.
Adding Breakpoints
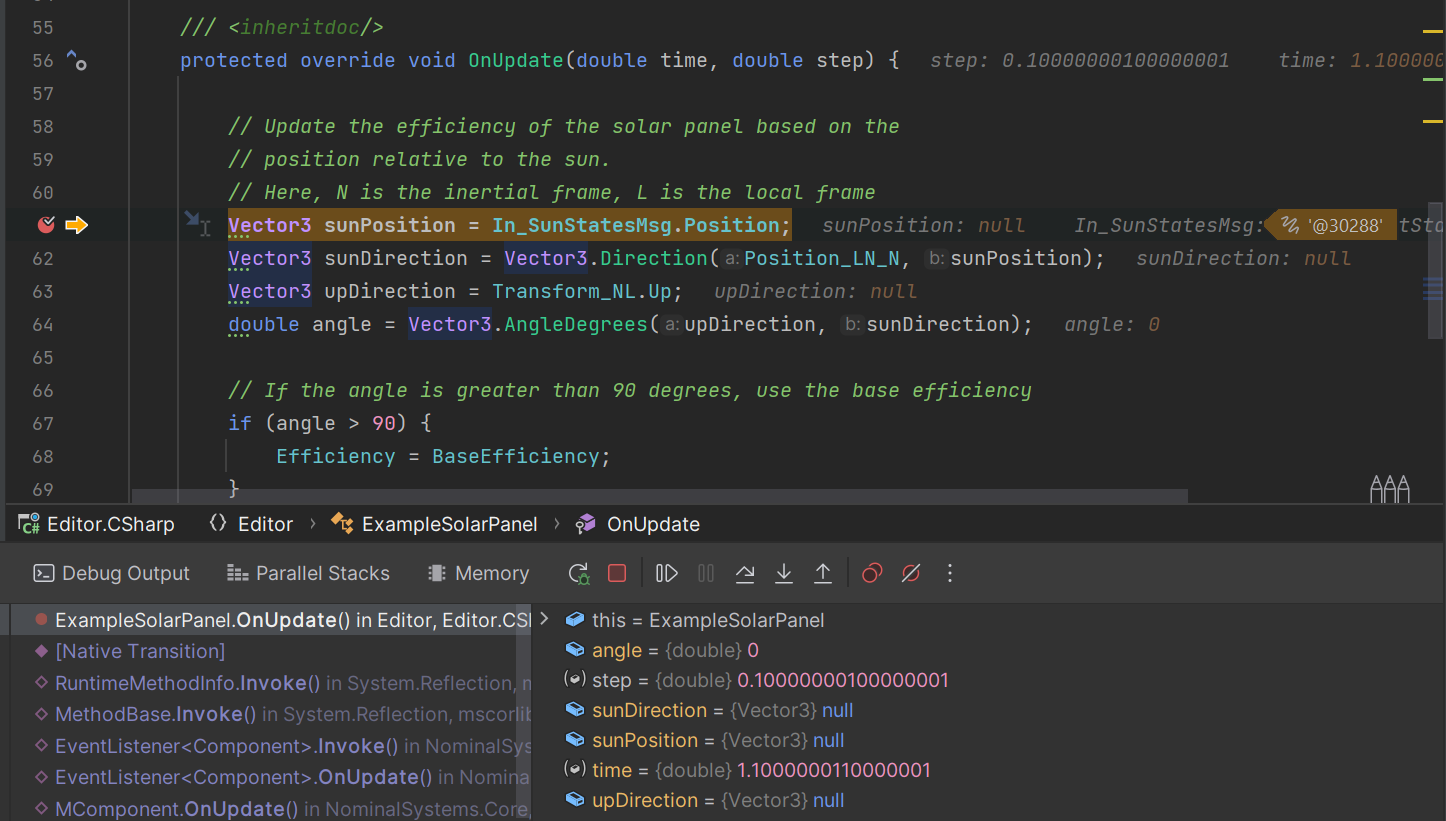
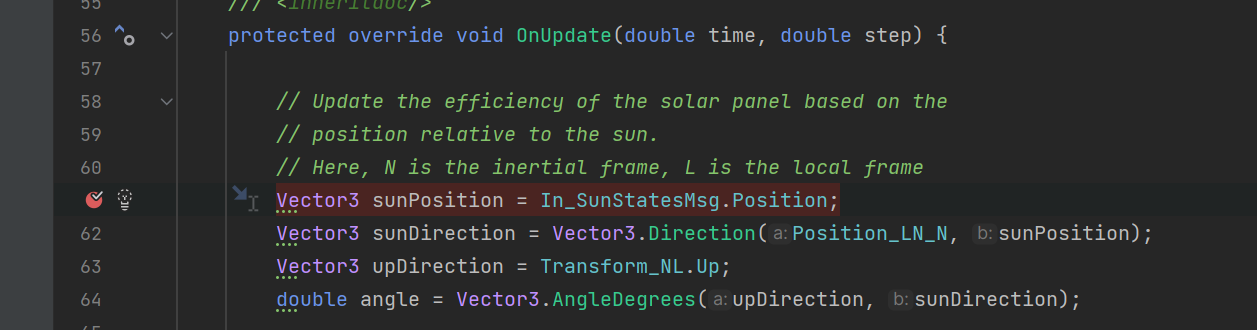
Breakpoints can be added to the classes at any location in the code. Select the line number and press down to add a breakpoint to the code. To remove the breakpoint, simply click on the red circle again.
Note
If the red circle has a tick next to it, this means that the debugger has correctly found a location in the source to connect to and is connected to Nominal Editor.
When the simulation is run and a break point is reached, the stack call will be present and data from the component and simulation can be read correctly within the break point. The controls are at the bottom for continuing, skipping and stepping over functions.