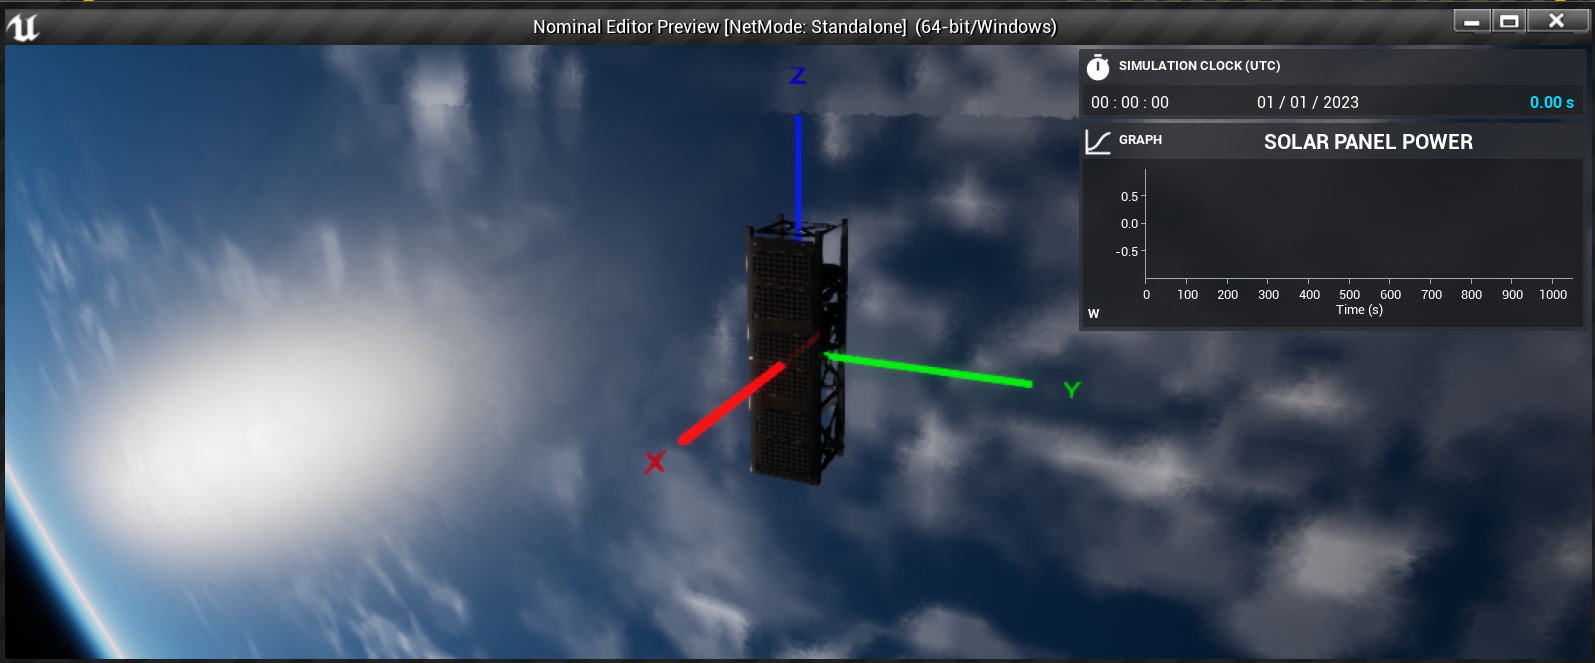
Spacecraft: Configuring User Interface
Adding in the User Interface
In Nominal Editor, the standard User Interface (UI) widgets are the Nom UI widgets. The Nom UI widget controls several widgets that can be displayed on the screen and allows for the visualization of graphs, maps and logged information. The first step to running the UI is to create an instance of the UI manager at the level. This is typically done as the last step of the Begin Play event on the level blueprint. Since this is a scene component (an object without a mesh), the object can be directly added to the scene using the Add Nom UI blueprint node.

After adding the node, make sure a reference to the node is saved. All function calls for updating the UI, regardless of the widget being used, should be called on this variable.
Note
In Unreal, scene component variables are typically added automatically to the Components dropdown of the variables section of the outliner. This is just the default location and they can be moved from this section if desired.
Adding a Clock
A standard widget that is present in almost all provided demos is the clock. The clock shows information about the simulation tick and the current epoch. To add the widget, use the Add Widget function on the Nom UI object reference. Many types of widgets can be added from here. The Add Widget | Clock is the correct function call in this case.

For each widget, there are several options for the position the widget is located. This will be the parented location for the widget. Left, Center and Right are columns where the widget can be placed and Bottom is a lower panel. By default, the right position is appropriate for the clock widget.
Note
Widgets are placed vertically in the order they are added to the level. If a different widget is added before the clock in the level blueprint then it will be placed higher on the screen than the clock. To reorder, move the blueprint blocks to the structure that is required.
Adding a Graph
The second widget that will be added to this tutorial is the graph widget. This allows for a custom graph to be drawn that plots some data on the Y-axis against the simulation time on the X-axis. This is used to show how some data points change over time. Graphs can be added in the same way as other components, including the clock. This function is the Add Widget | Graph node.

The graph widget comes with some additional parameters that can be tweaked for each of the graphs. There can also be more than one graph in the level.
- Title: The name of the graph title that is shown at the top of the graph.
- Data Axis Label: The data unit that is shown at the bottom for the Y-axis of the graph.
- Min Y Value: The minimum value the Y-axis can be. If left as 0.0, then there is no minimum and the graph will expand in size when needed.
- Max Y Value: The maximum value the Y-axis can be. If left as 0.0, then there is no maximum and the graph will expand in size when needed.
- Show Lines: A flag that specifies if the graph should join lines between the data points. This is typically left as enabled.
- Show Legend: A flag that specifies if the graph should show its legend of data. For single data graphs, this is usually disabled. Graphs can have several different data points on the same graphs and using different colours can help differentiate the data.
Updating the Graph
The clock is handled internally and the data does not need to be handled by the user. The graph widget is required to be manually updated by the user for each frame. The user needs to tell the graph what data to display on the screen and where to fetch the data from. This is done on the Tick event on the level blueprint. For graphing, some update functions can be called. These can be found under the Update Graph Widget nodes. These provide several helper functions for various data points that can be added to the graph.

For this example, the graph should display the power of the solar panel over time. This will be the Float Data function. Calling this function will require several values:
- Graph Index: The index number that the graph is associated with.
- Key: The data key of the data points. For a single data-sourced graph, keeping this as ‘Main’ is sufficient. This parameter is used to differentiate different data sources on the same graph.
- Float: This is the float value to add as a data point at the current simulation timestamp.
- Colour: The colour of the data point to add. This can only be configured on the first entry and does not change over time.
Note
The graph index is defined by the order the graphs are created. The first graph added to the level has an index of 0, the second graph has an index of 1 and so on. When changing the order of graphs, be sure to adjust the index in the update functions.
The float value in this case will be the power value from the solar panel. This can be found by dragging in the solar panel variable in the function blueprint finding the Get Power value exposed on the blueprint node and connecting it to the Float field.

Displaying the Graph
Once the graph configuration function is added to the Begin Play event and the updated graph is added to the Tick event on the level blueprint, the graphs will be updated each frame and will be shown to the level. Since the simulation has not started yet, the data will appear to be empty.
