Custom Components: Plotting Data
Adding User Interface
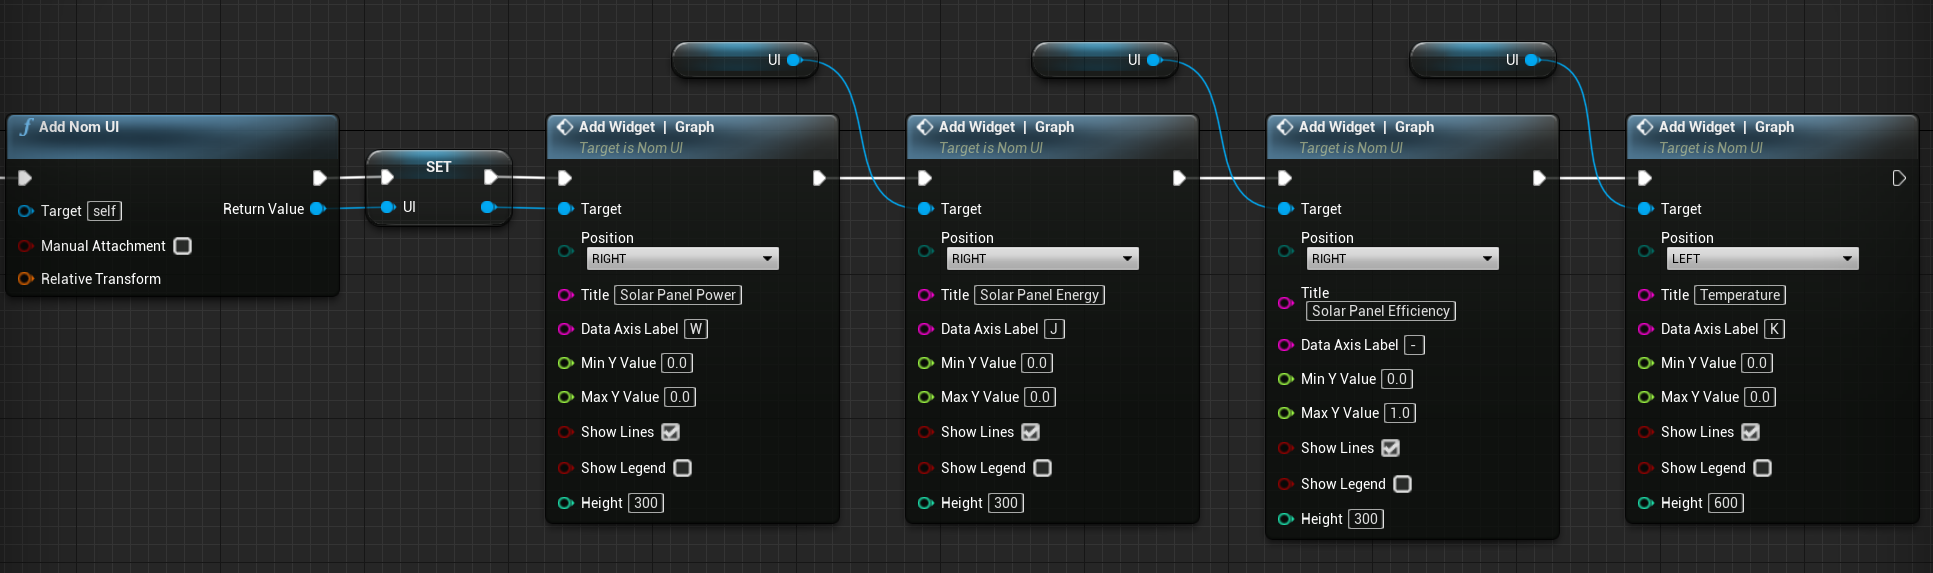
The last part of the simulation is to add the user interface to clearly show the data from the simulation. This is done in the Configure UI function. The Nom UI scene component is added and a few graphs will be added to the level. These will be:
- Solar Panel Power
- Solar Panel Energy
- Solar Panel Efficiency
- Thermal Sensor Temperature
Plotting the Solar Panel Data
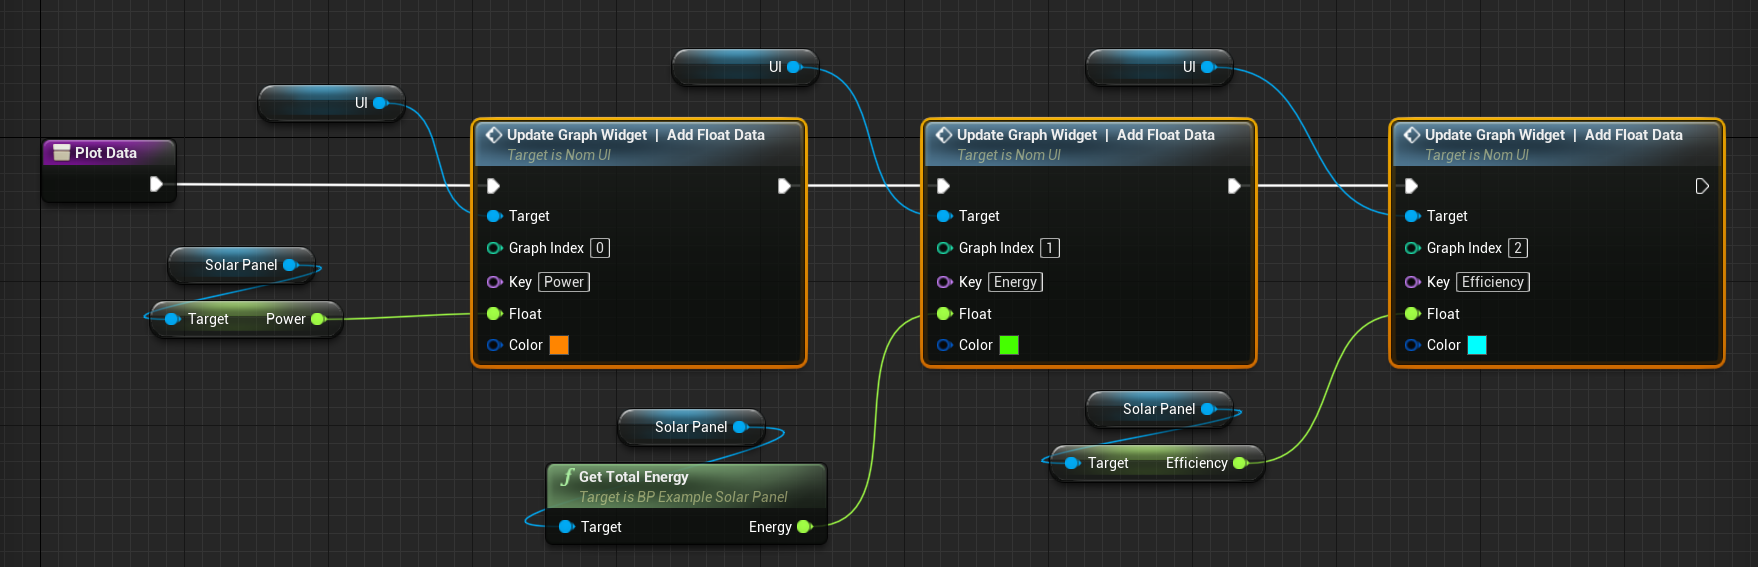
The next step is to create a Plot Data function that will add the solar panel and thermal data to the graphs added above. This will be done after the simulation is ticked on the main Event Tick event. Here, the parameters can be pulled from the solar panel for the power, energy (using the Mono function that was created on the custom solar panel) and the efficiency of the solar panel.
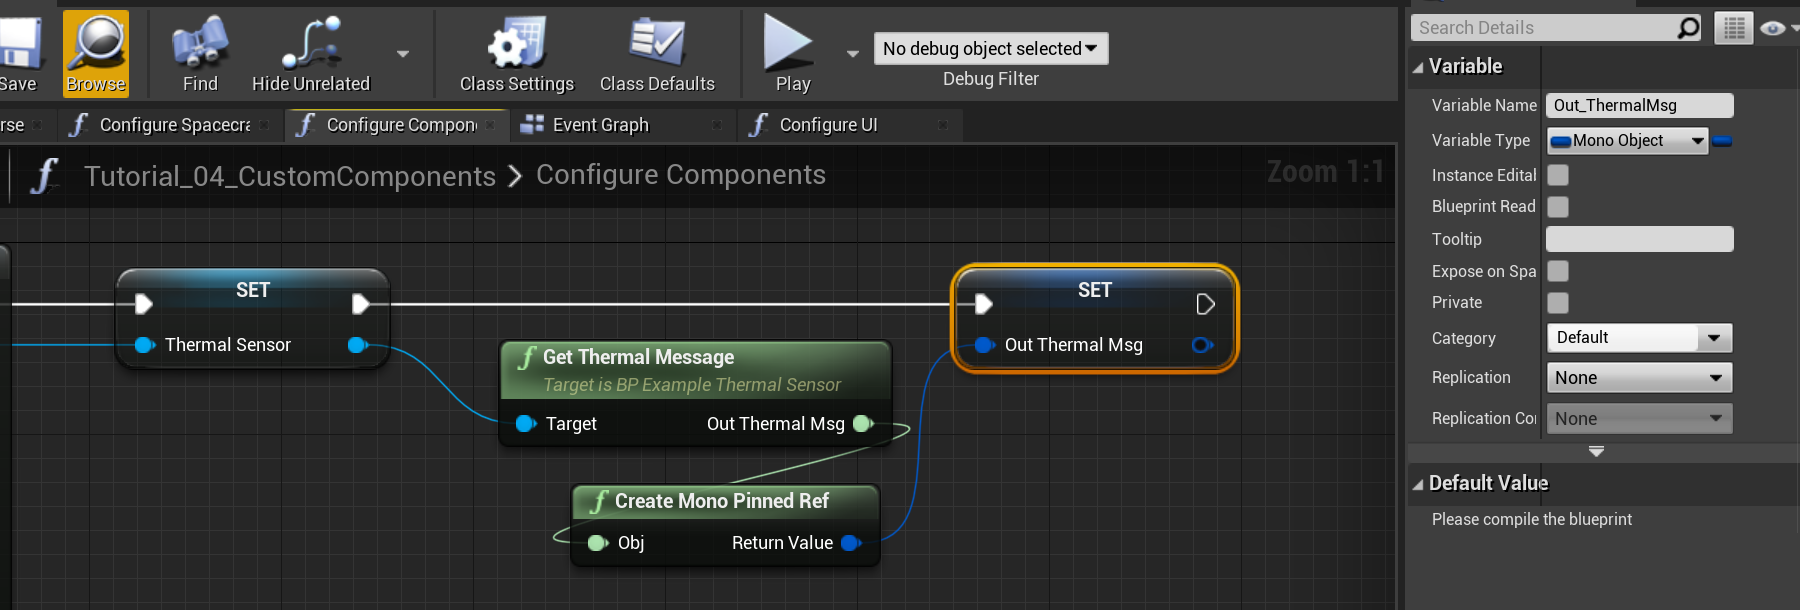
Storing a Message Reference
Since we will be using the Out_ThermalMsg a lot when reading the data for the temperature, it will be more efficient to store the message as an object reference once the object has been created. In the Configure Components function, we will grab the Mono object for the message using the function that was created previously and create a Mono Pinned Ref. This ensures that the reference will not be deleted and can be accessed throughout the simulation. This will then be stored as a variable in the level blueprint.
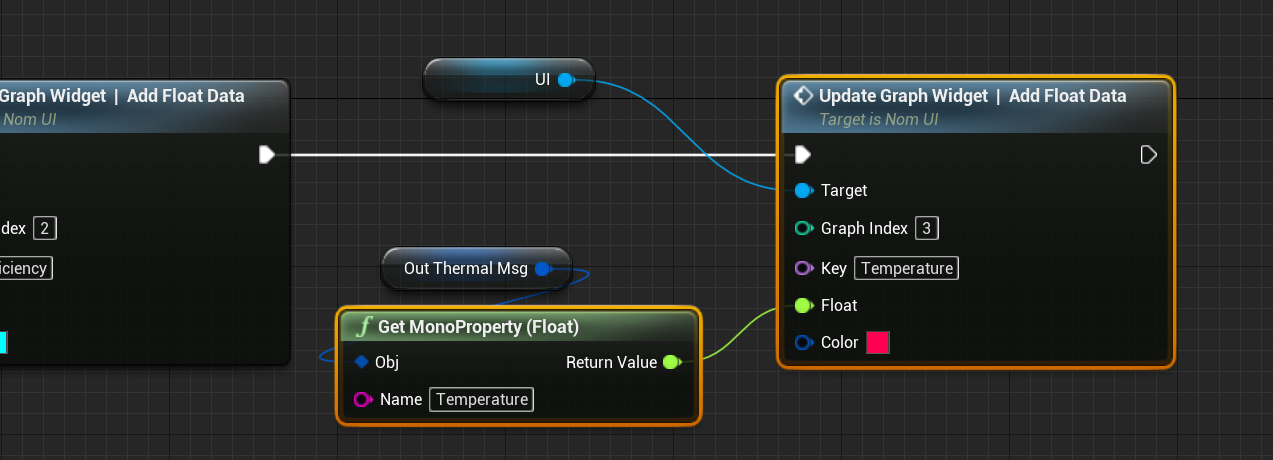
Plotting the Thermal Data
The final plot to add is the thermal data. This can be grabbed from the message that is stored and using the Get MonoProperty (Float) function, the Temperature parameter can be returned and added to the plot.
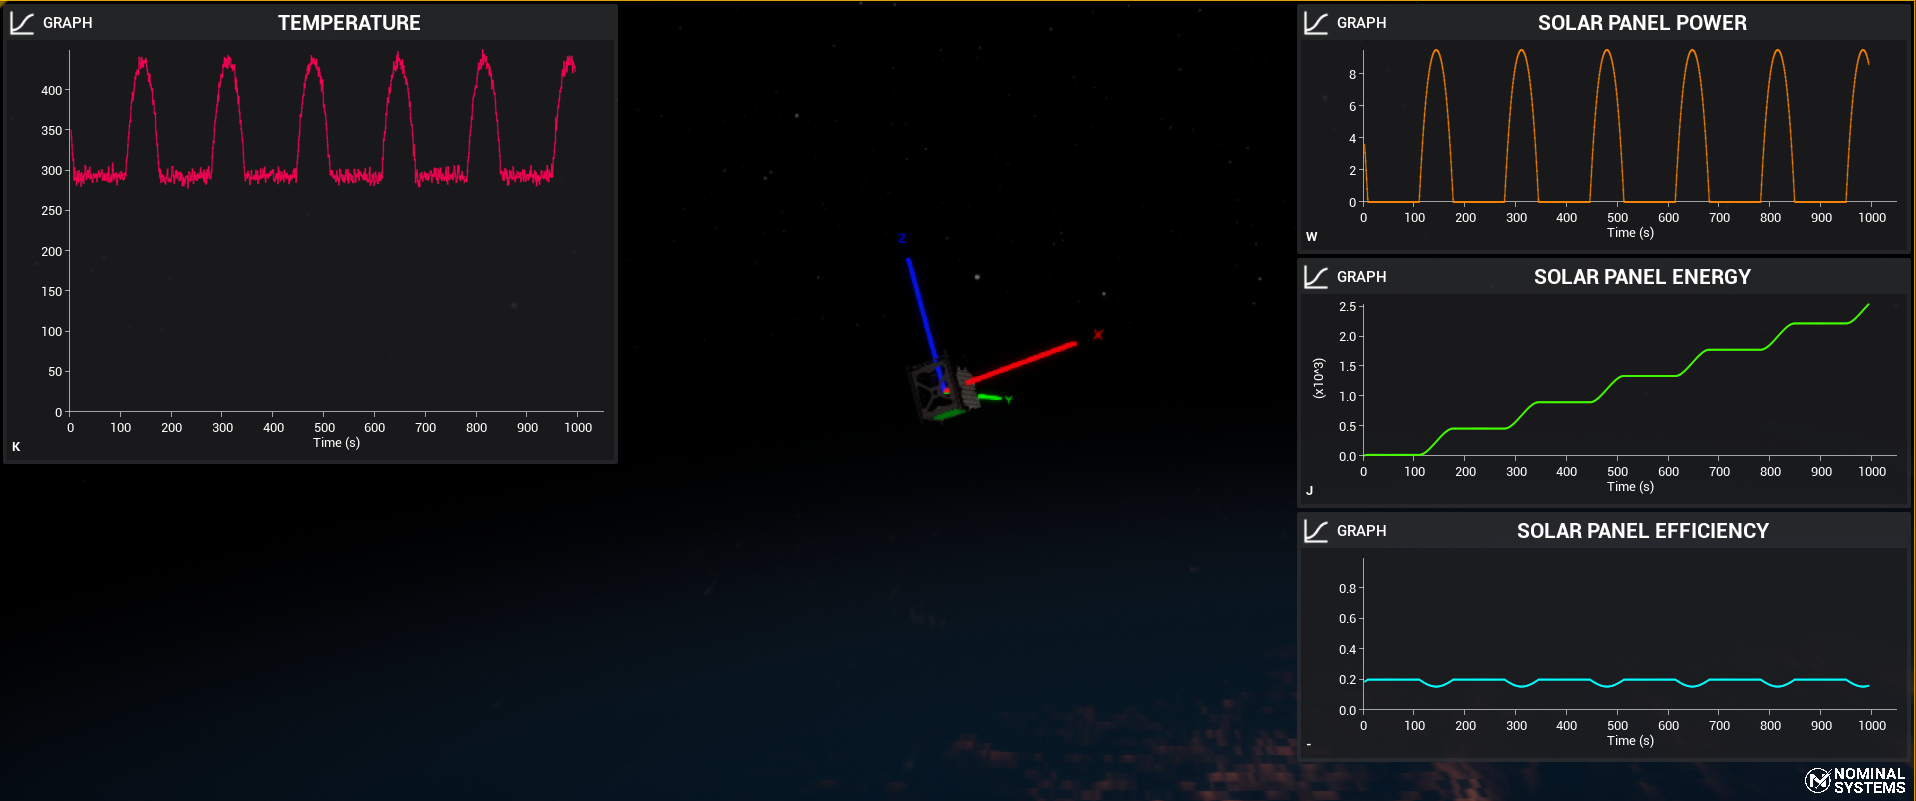
Final Level
When playing the final level, all of the graphs display correctly with the correct parameters. Notice the noise on the temperature reading is quite significant with the solar panel power. This was done by changing the noise parameter on the thermal sensor to 5.0 in the standard deviation.